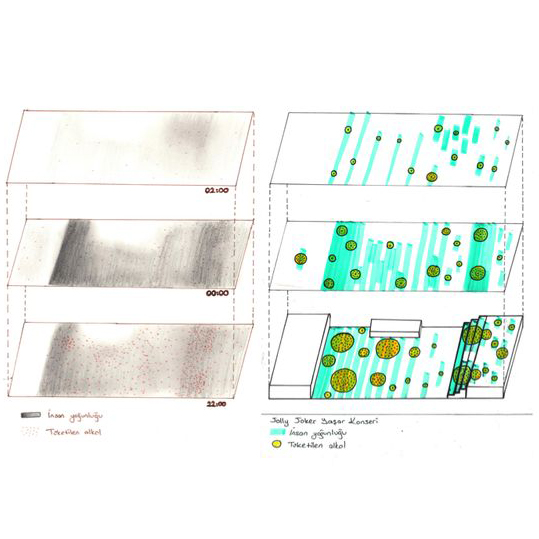

This is an archive of hand-drawn maps by many different people. We collect maps people draw for visually note-taking urban human activity. You can explore our full archive on this pinterest board.
Visualizing Spatio-Temporal Data
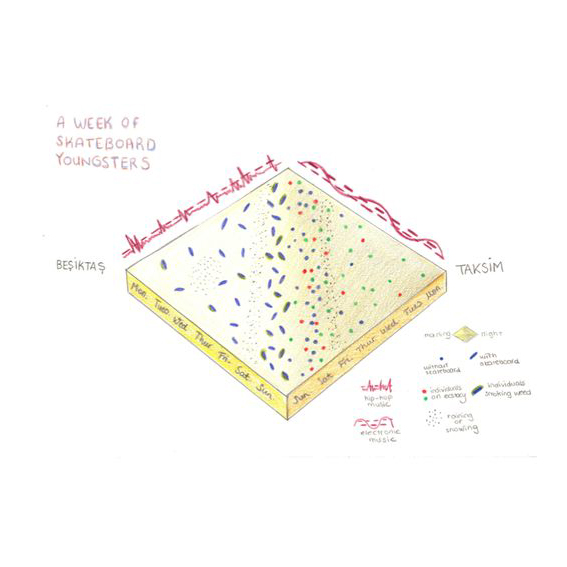
Maps of Urban Activity
Keywords:Human Activity; Visualization; Urban Data; Ethnographic Research
Team: Özge Genç, Damla Çay, Asım Evren Yantaç
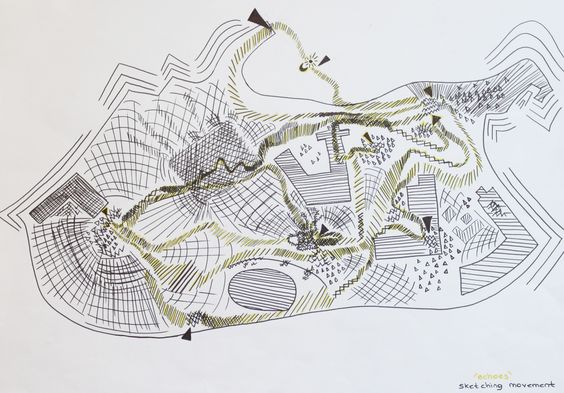
Map of Urban Soundscape
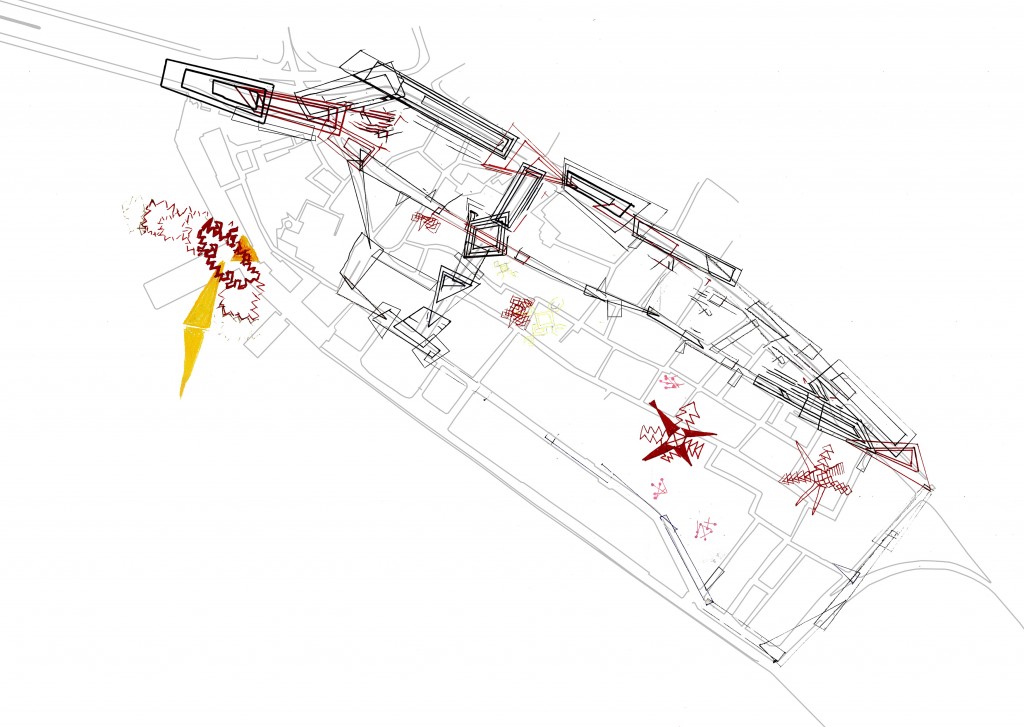

The aim of this study is to gain a better understanding of our auditory surroundings. To reach this goal, the technique that we have proposed is to visualize the matter of interest, which is sounds around us or soundscape in other words. Beside visualization technique, we have adopted to literature review and soundwalk methods to corroborate soundscape exploration. Ultimate outcome of the study is a layered soundmap of a particular district in Istanbul.
Keywords: Soundscape visualization; Attributes of sound; Soundmap
Team: Selman Yücetürk, Asım Evren Yantaç
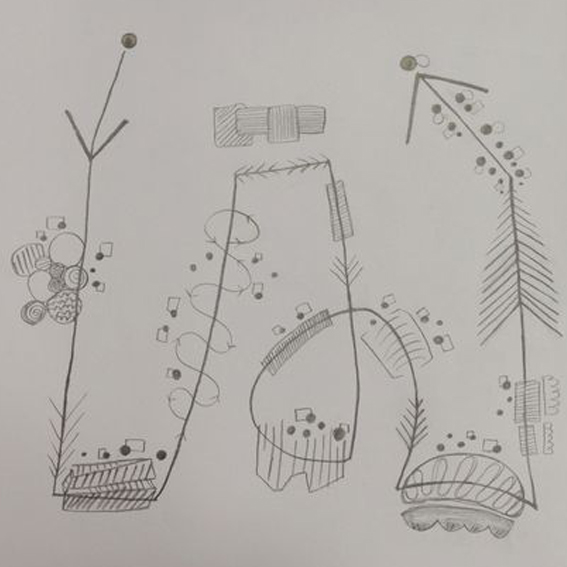
Map of Urban Smellscape

Visualizing data regarding space and time is always a challenging task. Yet, what really brings out this challenging aspect of design is trying to successfully visualize an intangible concept—and creating an urban olfactory map, for example. Here in this study, we focus on a case study regarding an urban smellscape, as well as coming up with visualization solutions for the representation of olfactory data. This study aims not only at contributing to the niche subject of olfactory map visualization, but also at providing insights for new visual representation methods for the urban scent archives and for the field of experience mapping.
Keywords: Smellscape, Visualization; Urban Data; Ethnographic Research
Team: Cansu Sayıcı, Asım Evren Yantaç
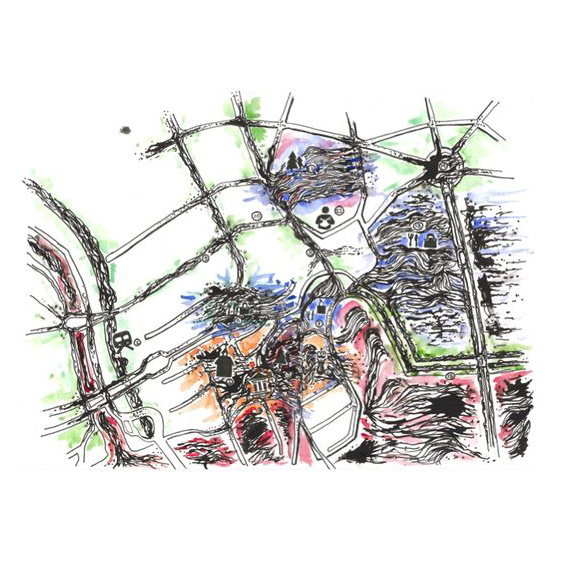
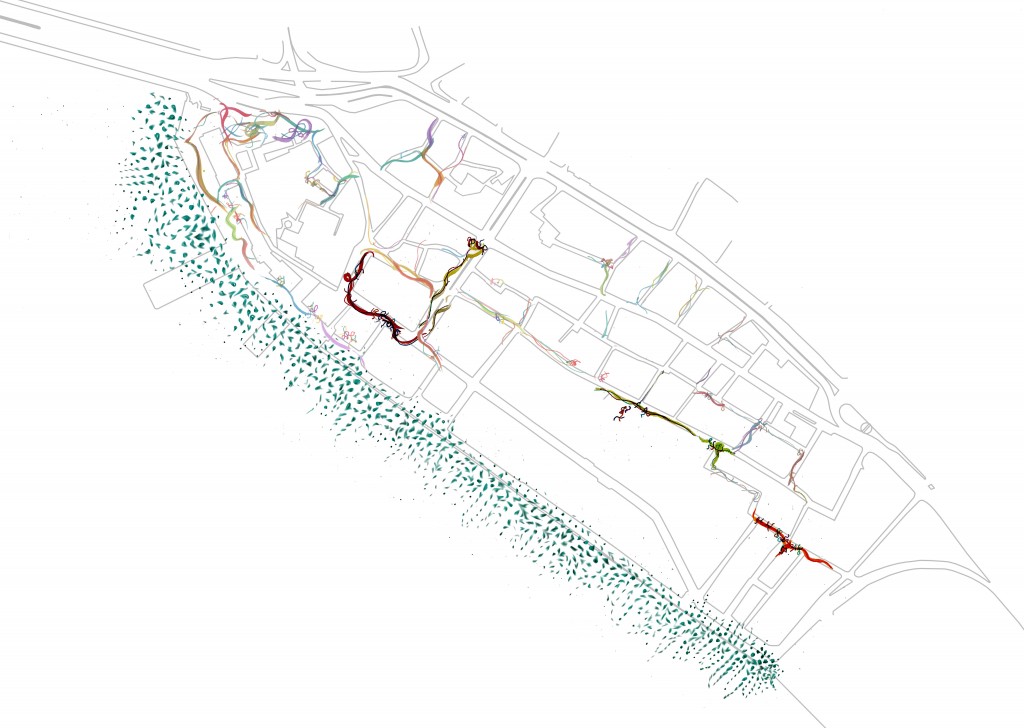
Map of Urban Emotionscape


Emotions are one of the key factors, which shape our relationships with ourselves, other individuals around us and even with lifeless materials. In order to understand them, some kind of tool is necessary. By considering emotions as a primary source of information, location-based visualization emotions is a challenging task. This paper explains a four month long design study on location-based visualization of emotions. By transforming emotions from intangible to tangible, it becomes easier to name places, which are “happy” or “depressed”, which gives people a chance to understand what and where they are feeling.
Keywords: Emotionscape; Visualization; Urban Data; Ethnographic Research
Team: Yağmur Gökçe, Asım Evren Yantaç